| Location | Contact Us | Vaginal Plethysmography | Penile Plethysmography | Safety Procedures |
Excerpted from The Psychophysiological Assessment of Female Sexual Function by Cindy M. Meston, Ph.D.
The psychophysiological assessment of female sexual function has a relatively short history in sexology (Rosen & Beck, 1998). It wasn’t until 1975, when Sintchak and Geer introduced the vaginal photoplethysmograph, that the first practical and reliable measurement device for vaginal blood flow was available. The introduction of the vaginal photoplethysmograph spurred great research interest in the area of female sexual arousal throughout the late 70s and early 80s. A number of publications arose that examined vaginal responses during various experimental manipulations, and assessed the diagnostic implications of this new measurement device. Since then, advances in understanding the female sexual response have slowed considerably. In fact, over the past decade and a half, only a handful of laboratories worldwide have focused exclusively on studying the female psychophysiological sexual response.
 Today, vaginal photoplethysmography remains the most frequently used method for monitoring vaginal blood flow. This technique was improved upon by Hoon, Wincze, and Hoon in 1976. The vaginal photoplethysmograph is a clear acrylic, tampon-shaped device that contains either an incandescent light source, or an infrared light-emitting diode as a light source, and a photosensitive light detector. The light source illuminates the capillary bed of the vaginal wall and the blood circulating within it. The amount of back scattered light is in direct relation to the transparency of engorged and unengorged tissue and, hence, serves as an indirect measure of vasoengorgement. Simply stated, the greater the backscattering signal the more blood is assumed to be in the vessels (Levin, 1992). The vaginal probe was designed to be easily inserted by the subject. A positioning shield can be placed on the probe’s cable in order to standardize the depth of insertion between uses (Laan, Everaerd, & Evers, 1995).
There are two components of the signal that can be derived from the photoplethysmograph. When the signal is coupled to a Direct Current (CD) amplifier, a measure of vaginal blood volume (VBV) is obtained. VBV is believed to reflect slow changes in the pooling of blood in the vaginal tissue (Hatch, 1979). The DC signal is used at low sensitivity and the standard dependent variable is change from levels of VBV at baseline. Because there is no discernible zero point with VBV, absolute measures of blood volume cannot be detected, hence the need to measure in units of blood volume change. When the signal is AC-coupled (alternating current), a measure of vaginal pulse amplitude (VPA) is obtained. VPA is believed to reflect
phasic changes in vaginal engorgement with each heart beat; 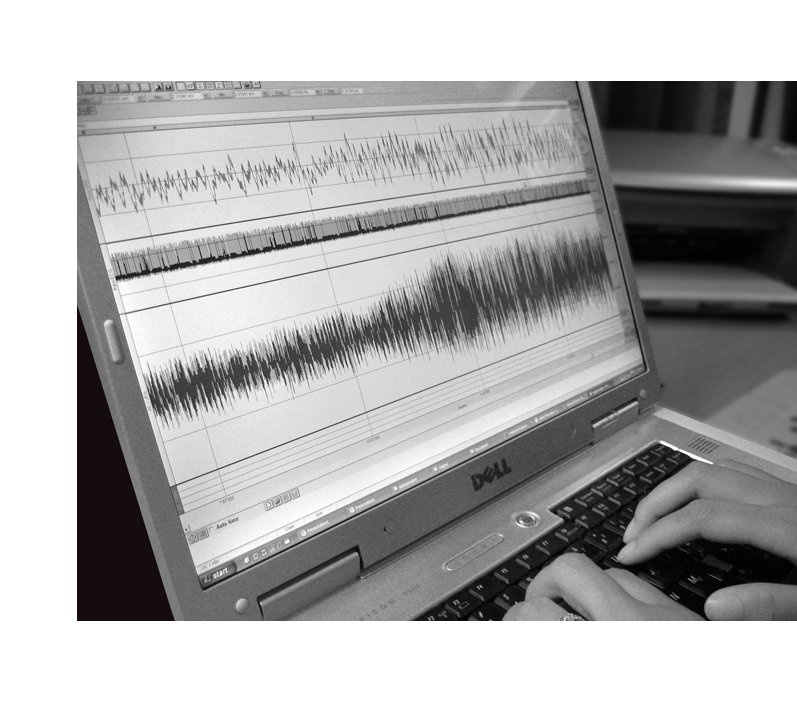 higher amplitudes indicate higher levels of blood flow (e.g., Geer, Morokoff, & Greenwood, 1974). The dependent variable typically used is the amplitude of the pulse signal, which is measured from the bottom to the top of the pulse wave. Analyses of VPA are usually conducted by either averaging across specific stimulus presentations, across the highest 20-30 seconds of arousal, or across selected time periods.
Advantages for using vaginal photoplethysmography as a technique for assessing female sexual arousal include (a) the ability of subjects to insert the probe in privacy, without the assistance of a researcher, (b) the ability to measure blood volume changes over relatively long periods of time without harm or discomfort to the subject, and (c) the relatively short period of time required for VBV and VPA levels to return to baseline, which allows for multiple, sequential stimulus recordings. Disadvantages of using this technique include (a) the inability to measure sexual responses during orgasm due to the sensitivity of the probe to movement artifacts, and (b) the lack of a sound theoretical basis for interpreting what exactly the signal means. As noted by Levin (1992), in some tissues an increase in VPA may represent a restriction of venous drainage rather than vasodilation per se. In addition, VBV and VPA signals provide no information as to whether the vasodilation is occurring in the arteries, arterioles, capillaries, venules or veins (Levin, 1992).